বাংলাদেশের ভোগ্�
বাংলাদেশের ভোগ্যপণ্...
If you’re managing sales, you already know it’s not just about closing deals. It’s about every step your team takes to get there. That’s where the Sales Activity Report comes in. It lets you track exactly what’s happening each day, each week, and helps you see whether efforts are turning into results.
I want to walk you through everything here. We’ll go deep into daily reports, logs, tracking tips, and even how to structure your report so it works for you, not against you. Whether you prefer Excel sheets or want something more automated, this guide covers it.
Many people in Bangladesh treat these reports like just another task on the checklist. Without tracking activities, you’re just guessing what’s working. These reports show you clear patterns. Are your calls leading to meetings? Are those meetings turning into offers? That’s the kind of insight you get.
What I also like about using a sales activity log is that it makes coaching easier. You can sit with your team and point to real data, not assumptions. It becomes less about feelings and more about facts, which is always helpful in sales.
Think about this: each day, your team is out there making calls, sending emails, and meeting clients. A daily sales activity report pulls all of that together. It’s like a snapshot of the day’s effort. And over time, those snapshots tell a story.
If you track daily, you can spot issues before they become problems. Maybe one of your team members is putting in fewer calls. Or maybe meetings are dropping off this week. Seeing it daily keeps you on top of things without any surprises.
Now, zoom out a bit. A weekly sales activity report doesn’t just show what happened, it reveals trends. Are deals picking up speed? Are follow-ups dropping? By looking at weekly summaries, you catch patterns that daily logs might miss.
What’s great is that weekly reports give you enough data to make changes, but you still act fast. You won’t have to wait a month to realize something’s off. This is why top sales teams always mix daily tracking with weekly reviews.

Let’s break it down. A solid report covers key activities. But here’s the trick: it should be simple enough to read fast, but detailed enough to get insights. So, what should a written sales summary report look like in BD?
First, list out the basic activities: calls made, emails sent, meetings held, proposals sent. Then, add results: deals closed, meetings booked, revenue generated. Keep this structure clear so anyone reading it knows exactly what’s going on.
You might also want to include follow-ups planned, as this shows future activity. And if you’re using a sales report template, make sure it covers both effort and outcomes. Effort shows hard work, outcomes show results. Both matter.
Let me tell you, it’s not just managers who gain from this. A salesman activity report helps individual reps, too. It shows them where they are strong and where they can improve. It’s like a personal scorecard.
When reps track their own activity, they become more aware of their habits. Are they focusing too much on emails and skipping calls? Are they following up enough? Seeing numbers in black and white pushes them to adjust on their own, without waiting for feedback.
Now, you’re probably wondering, what’s the best way to track all this? You have options. Some teams swear by the Excel daily sales tracking spreadsheet. It’s flexible, simple, and free. You can customize columns, add formulas, and share easily. It was the most common practice in Bangladeshi companies for several years.
Others prefer using their CRM or dedicated tracking tools. The benefit there is automation. Data gets logged as you work, saving time. Both formats work. It depends on whether you prefer manual control or automated convenience. Choose the one that fits your team’s style.
A great sales activity report does more than just record numbers. It tells the story of your progress, highlights your strengths, and reveals areas for improvement. Whether you’re reporting daily, weekly, or monthly, here’s what to include to make your report actionable and effective:
Your daily sales performance report should focus on logging all individual actions and outcomes. It keeps you accountable and lets you quickly adjust your strategy. Include:
This format is perfect for daily sales tracking. it focuses on actions and micro-results.
Weekly reports zoom out to spot patterns and bigger trends. They also make it easier for managers to evaluate team performance. Include:
Weekly reports help salespeople and managers understand both volume and conversion trends.
A monthly report gives a broad, strategic view. It’s usually used for setting goals, evaluating performance, and planning ahead. Include:
A monthly report is your chance to step back and align daily activities with your bigger sales goals.

Clear structure is everything. If your report looks messy, nobody will read it, and the whole point is lost. Start with activities, then results. Make each section separate. Don’t mix calls with meetings or emails with deals closed.
Also, use daily and weekly splits. Your daily report shows micro actions, while your weekly summary highlights broader trends. This layered structure makes reports more useful to both frontline reps and higher-level managers.
I’ve seen a lot of teams make reporting harder than it needs to be. They overcomplicate things. Too many fields, too much data. The key is to keep it focused. Track what matters and skip what doesn’t.
Another common mistake is waiting too long. If you don’t log activity daily, you forget details. That weakens the report’s value. So, build a habit of updating your sales activity log daily, even if it takes just five minutes.
Templates are a lifesaver here. A ready-made sales report template saves time and ensures consistency. You don’t have to think about structure every time. Just fill in the blanks and move on.
There are plenty of templates online, whether for Excel, Google Sheets, or CRMs. Pick one that matches your activity list. And remember, it’s okay to tweak templates. Make them yours so they feel natural to use every day.
You might be tempted to track everything. But trust me, not all activities are worth reporting. Focus on those that directly push deals forward. Calls, emails, meetings, and proposals, these are your core actions.
Other things like internal meetings or admin tasks can be tracked separately, but don’t clutter your main report. This way, your report for sales stays action-oriented. It keeps your team focused on activities that actually drive revenue.
I’ve gathered feedback from teams who’ve tried different styles of reporting. One tip they share is to review reports together every week. This keeps everyone aligned and makes reporting feel like part of the process, not an extra burden.
Another tip is to set activity targets. For example, 50 calls, 10 emails, and 5 meetings per week. When everyone knows the target, reports become a way to check progress, not just a formality.
By now, you can see that reporting is more than numbers. It’s about improving your team’s rhythm. When you track daily and weekly, you stay in tune with what’s working. You can adjust faster and close more deals.
That’s why using a daily sales performance report can lift your whole team’s results. It’s like fine-tuning a machine. Small tweaks based on real data lead to better performance over time.

Salesperson Name: John Carter
Reporting Period: April 1 – April 7, 2025
Region: North East Territory
Activities Summary (Weekly Totals)
Daily Breakdown
| Date | Calls Made | Emails Sent | Meetings | Demos | Deals Closed | Notes | Next Action |
| Apr 1 | 12 | 8 | 2 | 1 | 0 | Positive meeting with ABC Corp | Send proposal by Apr 3 |
| Apr 2 | 15 | 10 | 3 | 1 | 1 | Closed deal with XYZ Ltd | Schedule onboarding |
| Apr 3 | 10 | 7 | 2 | 1 | 0 | Objection from Bright Media | Follow up with answers |
| Apr 4 | 14 | 9 | 3 | 2 | 2 | Secured big order from GreenTech | Prepare contract |
| Apr 5 | 8 | 6 | 1 | 1 | 0 | Demo with Fresh Foods pending deal | Follow up call Apr 8 |
| Apr 6 | 16 | 12 | 3 | 1 | 1 | Won deal with Silver Motors | Invoice to be sent |
| Apr 7 | 10 | 8 | 1 | 0 | 0 | Light activity due to admin tasks | Plan next week leads |
Conversion & Performance
Highlights & Wins
Challenges Faced
Plan for Next Week
This kind of structured report works perfectly whether you’re using an Excel daily sales tracking spreadsheet, uploading to your CRM, or logging activities in Kothay.app. It shows daily hustle, weekly achievements, and forward-looking action, which is exactly what a solid sales report should deliver.

Some BD teams ask me, Should we do daily, weekly, or both? My answer is both, but with a balance. Use daily reports to track actions and weekly reports to track progress. This combo gives you real-time control and big-picture insight.
Daily reports keep everyone accountable. Weekly reports show whether those actions are turning into success. Skip one, and you risk missing out on either detail or direction.
Your sales cycle also affects your reporting. If you’re in high-volume sales, daily tracking becomes essential. If you work on long-term deals, you might focus more on weekly or even monthly summaries.
But even in long cycles, tracking daily activity helps keep the pipeline moving. So, adapt your sales activity tracking to your specific workflow. Make reporting serve your process, not the other way around.
Lastly, link your reports to your sales goals. If your target is $100K this month, break it down. How many calls, meetings, and proposals do you need to hit that? Then track those activities in your report.
When reports and goals match, your team stays focused. Every activity logged feels like a step closer to the target. This builds momentum and keeps energy high across the team.

Lara Roy, a sales rep at a mid-sized software company in BD, faced what many struggle with — good leads, but too few turning into closed deals. Her weekly sales activity report showed plenty of calls and meetings, but didn’t track deeper metrics like demo-to-close rates or reasons for drop-offs.
In February 2025, Lara started using a structured sales activity log. Each day, she not only logged how many meetings she held but also added notes on objections faced, next steps agreed upon, and whether decision-makers attended. She also began using an Excel daily sales tracking spreadsheet to visualize her activities over the week.
By the end of the first month, something shifted. She noticed that deals stalled mainly after demos, often because pricing concerns weren’t addressed early. Lara adjusted her pitch, added a pricing discussion in her first meeting, and started bringing in her manager for higher-value leads.
The next month’s sales report summary told a clearer story. Her demos-to-closed-deals rate jumped from 40% to 57%, and she closed 12 deals in March, up from 9 the month before. That’s a 30% increase, all from clearer activity tracking and quicker adjustments.
What’s more, Lara’s weekly sales activity reports made it easier for her manager to spot opportunities to coach her. Together, they refined her follow-up emails and doubled down on industries where her closure rate was strongest. By April, Lara had hit her quarterly target early and started mentoring new team members on reporting best practices.

Keeping up with daily or weekly sales reports can feel like extra work when you’re already chasing leads and closing deals. That’s exactly why I recommend looking at Kothay.app if you want reporting that works with you, not against you.
Instead of juggling spreadsheets and scattered notes, Kothay pulls your daily activities into one clean dashboard. You log your calls, meetings, demos, and deals in seconds, and the app turns them into neat reports without you lifting a finger. Whether you need a daily sales activity report, a weekly sales log, or a monthly performance summary, it’s all generated instantly.
What I really like about this Bangladeshi app is how it tracks more than just numbers. You can tag reasons for stalled deals, record next steps right after a meeting, and even track how many decision-makers you actually spoke to. Over time, this builds a clear picture of what’s working and where you can improve, just like Lara did in the case study.
And here’s the best part: Kothay doesn’t just give you reports, it shows trends. You can spot if your demos are going up but deals aren’t closing, or if emails are working better this week than last. It’s like having your own sales coach built into your reporting system.
So if you’re tired of clunky Excel sales tracking sheets and want to actually enjoy seeing your progress, Kothay.app is worth trying. It saves time, keeps you organized, and helps you hit your targets with less stress.
It’s a document that tracks sales efforts like calls, meetings, and emails, along with outcomes like deals closed.
Daily and weekly reports are ideal. Daily logs track actions, while weekly summaries show progress and trends.
Log calls made, emails sent, meetings held, follow-ups planned, and any deals advanced or closed.
Yes, many teams use an Excel daily sales tracking spreadsheet because it’s flexible and easy to customize.
It helps managers and reps see what’s working, adjust strategies, and improve performance through real data.
By now, you know that sales activity reports aren’t just paperwork; they’re your guide to better sales performance. When you track daily and weekly, structure your reports clearly, and focus on meaningful activities, you set your team up for success.
So, whether you’re using Excel, a CRM, or a simple template, the important thing is to start and stay consistent. Over time, these reports will improve them.
I want to try Close for free for 30-Days. (Say YES!!!)
Bangladesh’s pharmaceutical sector is one of the coun...
bitcoin swap monero
You must be logged in to post a comment.
Sign up now to simplify your sales operations, improve productivity, and make data-driven decisions. Choose your plan, add your team, and unlock the full potential of your sales strategy. Don’t wait – elevate your sales management game and drive success with us!
Get Started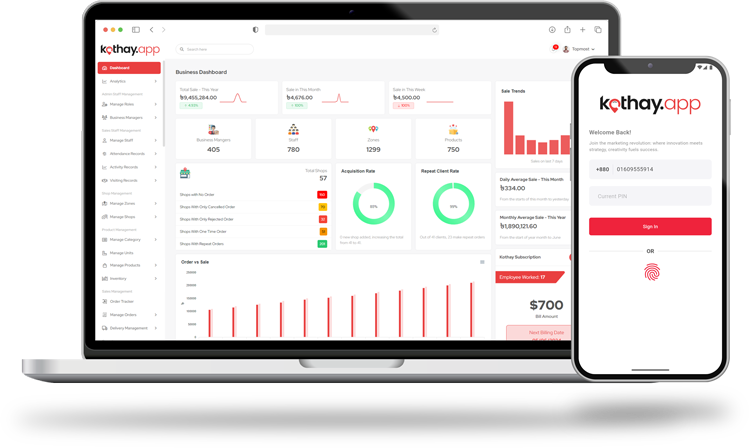
21 Comments
Conor
This is a test comment