Salesman Tracking vs Sales Tracking: Which On
In the world of modern sales management, two distinct t...
What is the right way to improve your sales performance? Normally, we think onboarding experienced sales reps and managers and launching valuable goods will increase our sales. But does it actually happen?
Sales performance analysis involves evaluating a business’s sales data to understand how well it, its teams, or individual salespeople are performing
Sales performance analysis using automated tools and reports has become a crucial element to determine growth, obstacles, and opportunities, all at once. Analytics converts numbers into statements of your team’s performance.
Today, we will describe everything about sales analysis, KPIs, tracking, dashboards, and relevant software so that you can get real results. By the end, we’ll also inform you how Kothay app can be your all-in-one sales management solution.
So, let’s dig in.
Sales performance analysis is a method where you examine or evaluate the numerical data collected on your employees’ activities, customer behaviors, results of your sales process, etc. Then, the evaluation explains your growth rate, progress, efficiency, downfalls, and ignored possibilities, all in a narrative or visualized form.
In 2025, sales performance reporting will also help to forecast the right strategy for a company to grow. Note that salespersons meeting their weekly or monthly goal isn’t the actual result or performance you need to grow your business. What you’re achieving from the overall team is your main result.
According to Outreach, sales performance is a key barometer for the health of any company. It reflects an organization’s ability to anticipate and meet market demands while building a sales team that’s equipped to engage customers and drive revenue growth.
For example, you see all your sales reps are meeting their monthly goals, yet you’re not getting the average conversion rate. If you analyze the overall sales pipeline manually or using tracking software, you might understand what’s stopping you from growing well.
It can be that your reps aren’t responding to customer queries fast, there are tons of complaints about the packaging, or your managers aren’t picking the most cost-effective routes. A complete analysis can help you figure out the real problem that’s killing your potential.

Analyzing sales performance isn’t restricted to collecting numbers only. The report drives smarter decisions, efficient strategies, and consistent growth, especially when you run your company in a developing country like Bangladesh.
Among several ways to improve sales performance, making a complete performance analysis report is the first job for any business authority. It is the first step to make a valid approach in your business.
Now, let’s describe how sales performance reporting will help a company.
You can easily figure out the pitfall areas in your sales pipelines when you properly analyze the whole performance. Is it the slow response from your team, poor lead filtering, or stalled negotiations? Tracking data of each pipeline stage, you can point out the bottlenecks and resolve them before they cause a huge collapse.
The brutal truth is that not everyone in your team will excel or work with full dedication. Sales analysis will also help to create individual work profiles of each sales rep. This helps compensate the deserving employees, puts underwhelming performers under training, and boosts overall productivity.
Historical data and real-time metrics are two main elements to forecast company sales properly. You can accurately predict revenue and plan to improve your current tactics. Another big advantage of measuring sales performance KPIs is to reduce any sort of financial surprises. It leads to better inventory management, budget allocation, and resource planning.
Like said earlier, guesswork means putting everything on the line by relying on your luck only. You need to change your decisions, alter the strategies, and recruit experienced heads depending on the actual condition. Sales performance analysis gives you results based on KPIs and suggests the best changes based on market trends.
A perfectly analyzed sales strategy will help to convert leads better and faster. It will help you to improve deal velocity, average deal size, and customer engagement rates. Optimizing the pipelines unlocks sustainable revenue growth and higher customer lifetime value.
The whole process also involves the performance based on product types, customer segments, and regions. Admins can spot untapped markets quite easily. So, the opportunities to cross-sell, upsell, and expand reach become easier than ever. You can also create a perfect client avatar or persona to maximize your marketing impact.
Performance analysis reveals customer buying patterns and preferences. This insight allows sales teams to recommend better solutions, cross-sell effectively, and improve service quality. Happier customers mean repeat business and stronger brand loyalty.
In short, sales performance analysis doesn’t just measure success, it creates it. With tools like Kothay.app, you can turn complex data into clear actions, optimize every part of your sales process, and set your team up for long-term success.
Let’s make one thing clear: not every number matters equally. Focusing on the right sales performance metrics gives you clarity. Metrics like conversion rate, average deal size, and sales cycle length give you the clearest picture of how well things are moving.
Your sales effectiveness analysis should also track individual rep performance and how much time is spent on productive tasks. Are they spending more time closing or stuck in admin work? That’s the kind of insight that pushes performance forward. By using sales management and performance tracking tools, you can watch these numbers in real-time.

The very first thing to measure is the sales growth for your team’s overall success. Here, the analyzer measures how much revenue has increased from one period to another. You get insights into the sales strategies and their impacts. Monitoring sales growth also helps to set realistic sales targets and future forecasts. Any decline in the growth chart will signal to you to change your current approach.
It reveals how effectively your sales team is convincing leads to buy your goods. Normally, the ideal conversion rate seems to be over 10% (source: Databox). But tracking conversion rate optimizes customer targeting, refines outreach efforts, and improves pipeline efficiency. Which leads makes you among those 10% of companies that ensure a 40% conversion rate in BD or any other country.
Average deal size tells you how much revenue each sale brings in. This is the most important metric to forecast sales and pipeline planning. Deal size growth will refer to successful upsells or high-value clients.
The time taken by a lead to move from initial contact to a closed deal is the cycle length. A shorter sales cycle means your team is very efficient and capable of generating revenue at a good speed. The opposite scenario will indicate that you have too many approval steps or misaligned touchpoints for customers.
It is the total expense involved in turning a prospect into a customer. This includes marketing spend, sales team costs, and related overhead. Keeping CAC under control is vital for maintaining healthy profit margins. High acquisition costs can eat into revenue, while optimized CAC ensures you’re maximizing the return on your marketing and sales investments.
This conversion rate is closely related to overall conversion. It zeroes in on how effectively your marketing efforts are feeding qualified prospects into your sales funnel. You’ll understand the percentage of leads generated that actually convert into paying customers. High conversion rates suggest that your targeting, messaging, and lead-nurturing strategies are aligned with customer needs.
For businesses operating in multiple markets, tracking sales by region offers vital insight into geographical performance differences. Sales by region can highlight where your products or services are most in demand or not. Companies can allocate resources strategically and tailor the approach to local preferences with the help of this metric.
Here, you can evaluate the offers that are driving the most of your revenue. You have to analyze sales volumes and customer feedback for each product.
Sell-through rate measures how quickly inventory is sold after it’s received from suppliers. This insight is required for demand forecasting and inventory management. A high sell-through rate indicates strong sales momentum and efficient stock turnover, while a low rate may suggest overstocking or weak demand.
This metric tracks the performance of individual sales reps, providing a clear view of productivity across your team. By measuring the revenue generated or deals closed per representative, you can identify top performers and areas where additional training or support may be needed. Encouraging healthy competition and offering targeted coaching based on this metric can boost team morale, refine skills, and ultimately drive better sales outcomes across the board.

Analyzing sales performance has become easier thanks to sales report tracking and sales CRM software. Let’s discuss how to use automated sales trackers to define your sales performance.
The first step is to gather all the necessary data to date. If you have a CRM system installed, it’ll be easier for you to pull information like sales reports, revenue sheets, net income, expenditure, etc. Don’t forget external data sources like market trends and industry benchmarks. Make sure your data is clean, consistent, and up-to-date to help the AI give the right insight.
Next, define key sales metrics you need to track for your analysis. Generally, admins consider revenue growth, conversion rates, average deal size, etc., as primary pillars of the process. Pick metrics based on your business model. Considering unnecessary KPIs will manipulate the final report.
At this point, work on your dedicated sales management software to analyze your sales pipeline and conversion rates. Differentiate each stage of the funnel. It makes troubleshooting easier. Focus on the conversion, approach, and efficiency of each funnel stage to figure out both positives and negatives.
We already told you to gather up industry benchmarks beforehand. Now, the numbers you get after the analysis will be compared to those standard bars. You can compare with historical data as well.
Classify your sales data into product type, region, assigned salesman, and customer type. It will clarify your report more and help you understand which product is generating more money in your business. You’ll also be able to identify underperforming areas to focus on.
If you use the latest automated platforms like Kothay and Zoho, you can easily visualize the whole report in detailed graphs, charts, and tables. It makes taking decisions easier for the whole administrative board.
Finally, turn your analysis into actionable insights. Identify specific steps to improve sales performance, whether it’s refining your sales tactics, providing additional training, optimizing your sales process, or adjusting targets. Make sure to implement changes based on your findings and continue to monitor results to ensure ongoing improvement.
Let’s be honest. Doing all this manually is painful. That’s where sales performance software comes in. Platforms like Kothay.app from Bangladesh give you dashboards, reports, and analysis tools that pull data automatically, so you can focus on improving, not number crunching.
Using sales productivity analytics software means your team can spot weak points fast. Say a product isn’t performing well this month—analytics alerts you before it hurts your revenue. You also get automated sales performance reporting, saving you hours every week.
Imagine logging in every morning and seeing your team’s performance at a glance. That’s what a good sales performance metrics dashboard offers. Quick, clear, and actionable.
Weekly or monthly reports help you compare performance over time. You see if the changes you made are working or if it’s time to try a new tactic.
Live sales performance tracking keeps the team alert. Small issues get fixed before they grow into missed targets.
Salesmen who are always in the field to engage and convert leads are hard to track and evaluate. Field force tracking software will help in zone management, live location tracking, instant lead updates, etc.
Let’s cut through the noise. You want ways to improve sales performance that actually work. The first step is clear goals backed by the right KPIs. If your team knows exactly what’s expected and how success is measured, performance goes up.
Next, coach smarter. Use your sales analytics KPIs to tailor training. If someone struggles with closing, focus there. If another rep’s issue is qualifying leads, fix that. Personalized coaching beats generic advice every time.
Don’t just say “sell more.” Break it down into daily calls, meetings, and deals. Small wins build momentum.
It’s not only about closing deals. Celebrate activities like follow-ups and proposals sent, as they lead to sales down the line.
By checking which products bring the most profit, you guide your team to focus energy where it pays off. Less wasted effort, more revenue.
Most people miss this, but product performance analysis is gold. If you’re pushing products that aren’t moving, your team works harder for less. By analyzing product data, you can shift focus to what’s actually in demand.
With kothay.app, you can track how each product performs across different regions, times, and customer types. That means smarter stock management and sharper sales tactics. Products that lag can either be improved or replaced, and winners get pushed harder.
A product selling well but with low profit margins might not be worth the hype. Always check profit alongside sales numbers.
Some products spike at certain times. Spotting these patterns helps you plan campaigns that hit right when demand peaks.
Product data also shows which items sell together. Use this to train your team on bundling offers, boosting deal sizes naturally.
You might think tracking more numbers means better insights, but often, it leads to confusion. And most local B2B brands in Bangladesh have the same opinion.
One of the biggest mistakes teams make is focusing only on past results, like total revenue, without checking the steps that got them there. If you’re only looking at final sales, you miss where the real problems start, like weak lead conversion or low follow-up rates.
Another issue is relying on outdated reports that don’t reflect current performance. Sales is fast-paced, and if you’re looking at last quarter’s data, you’re always playing catch-up. Some teams also track every possible metric, which spreads their focus too thin. It’s smarter to pick a handful of KPIs that actually connect to your goals.
To avoid these mistakes, keep your analysis timely, actionable, and tied to clear objectives. A tool like Kothay.app can help by offering real-time dashboards and easy-to-read reports so you’re always analyzing fresh data, not old numbers.
Every sales team has its own rhythm, and picking random metrics won’t help you improve. For example, a B2B team should care about deal cycle length, proposal-to-close ratio, and meetings booked. A B2C company selling products might focus more on average order value, cart abandonment rate, and product-level sales performance.
The key is to tie metrics directly to the actions your team controls. Are you trying to shorten your sales cycle? Then track time-to-close and follow-up response time. Want to boost revenue? Then keep an eye on upsell rates and average deal size. Don’t copy another business’s KPIs — shape your analytics around your unique goals.
Kothay.app lets you customize which sales performance metrics appear on your dashboard. That means whether you’re tracking product sales performance or analyzing your team’s daily productivity, the data fits your strategy, not someone else’s.
Let’s bring this down to earth. A software company I worked with once struggled with low conversion rates. After analyzing their sales calls, they spotted a pattern: their reps were skipping discovery questions. By training the team to improve those early conversations, they raised their call-to-meeting conversion by 18% in three months.
In another case, an eCommerce brand used product sales performance analysis to notice that certain items had high page views but low purchases. By adjusting their pricing and promoting those products differently, they increased sales of those items by 25%.
These are just small snapshots, but they prove that analyzing the right data and then acting on it can directly boost sales outcomes. And that’s where using performance tracking software like Kothay.app gives you an edge: it turns raw numbers into actions you can take today.

Here’s something a lot of people overlook: if your sales performance tools and CRM aren’t connected, you’re doubling your work. Manually moving data between systems leads to errors and slows everything down. But when your analytics software syncs directly with your CRM, tracking and reporting become automatic.
For example, by connecting Kothay.app with platforms like Salesforce or HubSpot, you can track every deal, call, and follow-up in real time. That way, your dashboard always shows fresh numbers without anyone on your team having to update reports manually.
Integration also means your sales reps spend less time on admin work and more time selling. Plus, your managers get a clearer view of performance trends without waiting for end-of-month reports. It’s a win for both productivity and accuracy.
Now, let’s talk about how to make all this simpler. Kothay.app gives you everything you need for analyzing sales performance in one place. From tracking your team’s daily numbers to analyzing product performance, it covers every angle.
Instead of juggling multiple tools, you get clear dashboards, automated reports, and alerts when things slip. You also save time, as sales performance reporting happens in the background while you focus on growing your business.
With features like real-time tracking, product analytics, and customizable KPIs, kothay.app turns performance analysis from a chore into a competitive edge. It’s built to help you enhance sales performance without extra stress. It the best sales tracking tool in BD with every feature you need.
It’s the process of tracking and evaluating sales data to improve team results and find ways to boost revenue.
Focus on better tracking, clear KPIs, and coaching your team based on real data, not guesses.
Conversion rates, average deal size, sales cycle length, and product performance are key numbers to watch.
Yes, tools like kothay.app simplify tracking, reporting, and analysis, saving time and boosting results.
Absolutely. It shows which items perform best, helping your team focus on what brings the most profit.
If you’ve been waiting to see your sales numbers climb, now’s the time to act. Start with simple sales performance analysis steps, track your team’s daily wins, and keep an eye on product data. The more you measure, the more you improve.
And if you want this whole process to feel smooth and easy, kothay.app is your go-to. With its dashboards, reporting tools, and tracking features, you’ll not only manage your sales performance but actually increase it. Let’s get your sales back on track today.
I want to try Close for free for 14 days. (Say YES!!!)
In the world of modern sales management, two distinct t...
Sales teams, especially field sales representatives, ar...
The Beverage distributors in Bangladesh, including soft...
You must be logged in to post a comment.
Sign up now to simplify your sales operations, improve productivity, and make data-driven decisions. Choose your plan, add your team, and unlock the full potential of your sales strategy. Don’t wait – elevate your sales management game and drive success with us!
Get Started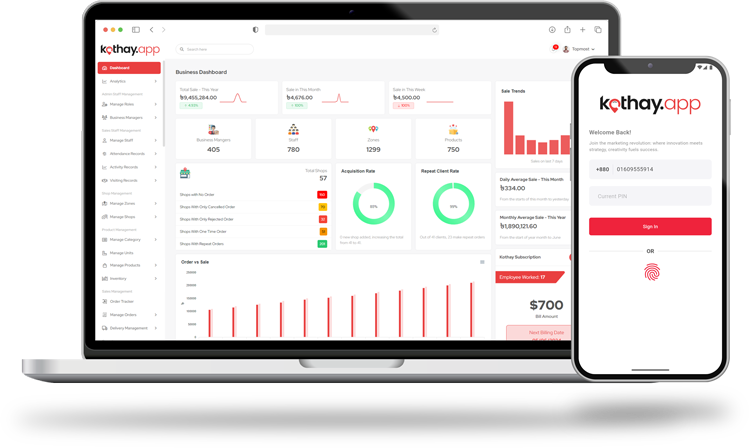
20 Comments